Female Career Success: Past, Present, and Future
Female Career Success: Past, Present, and Future

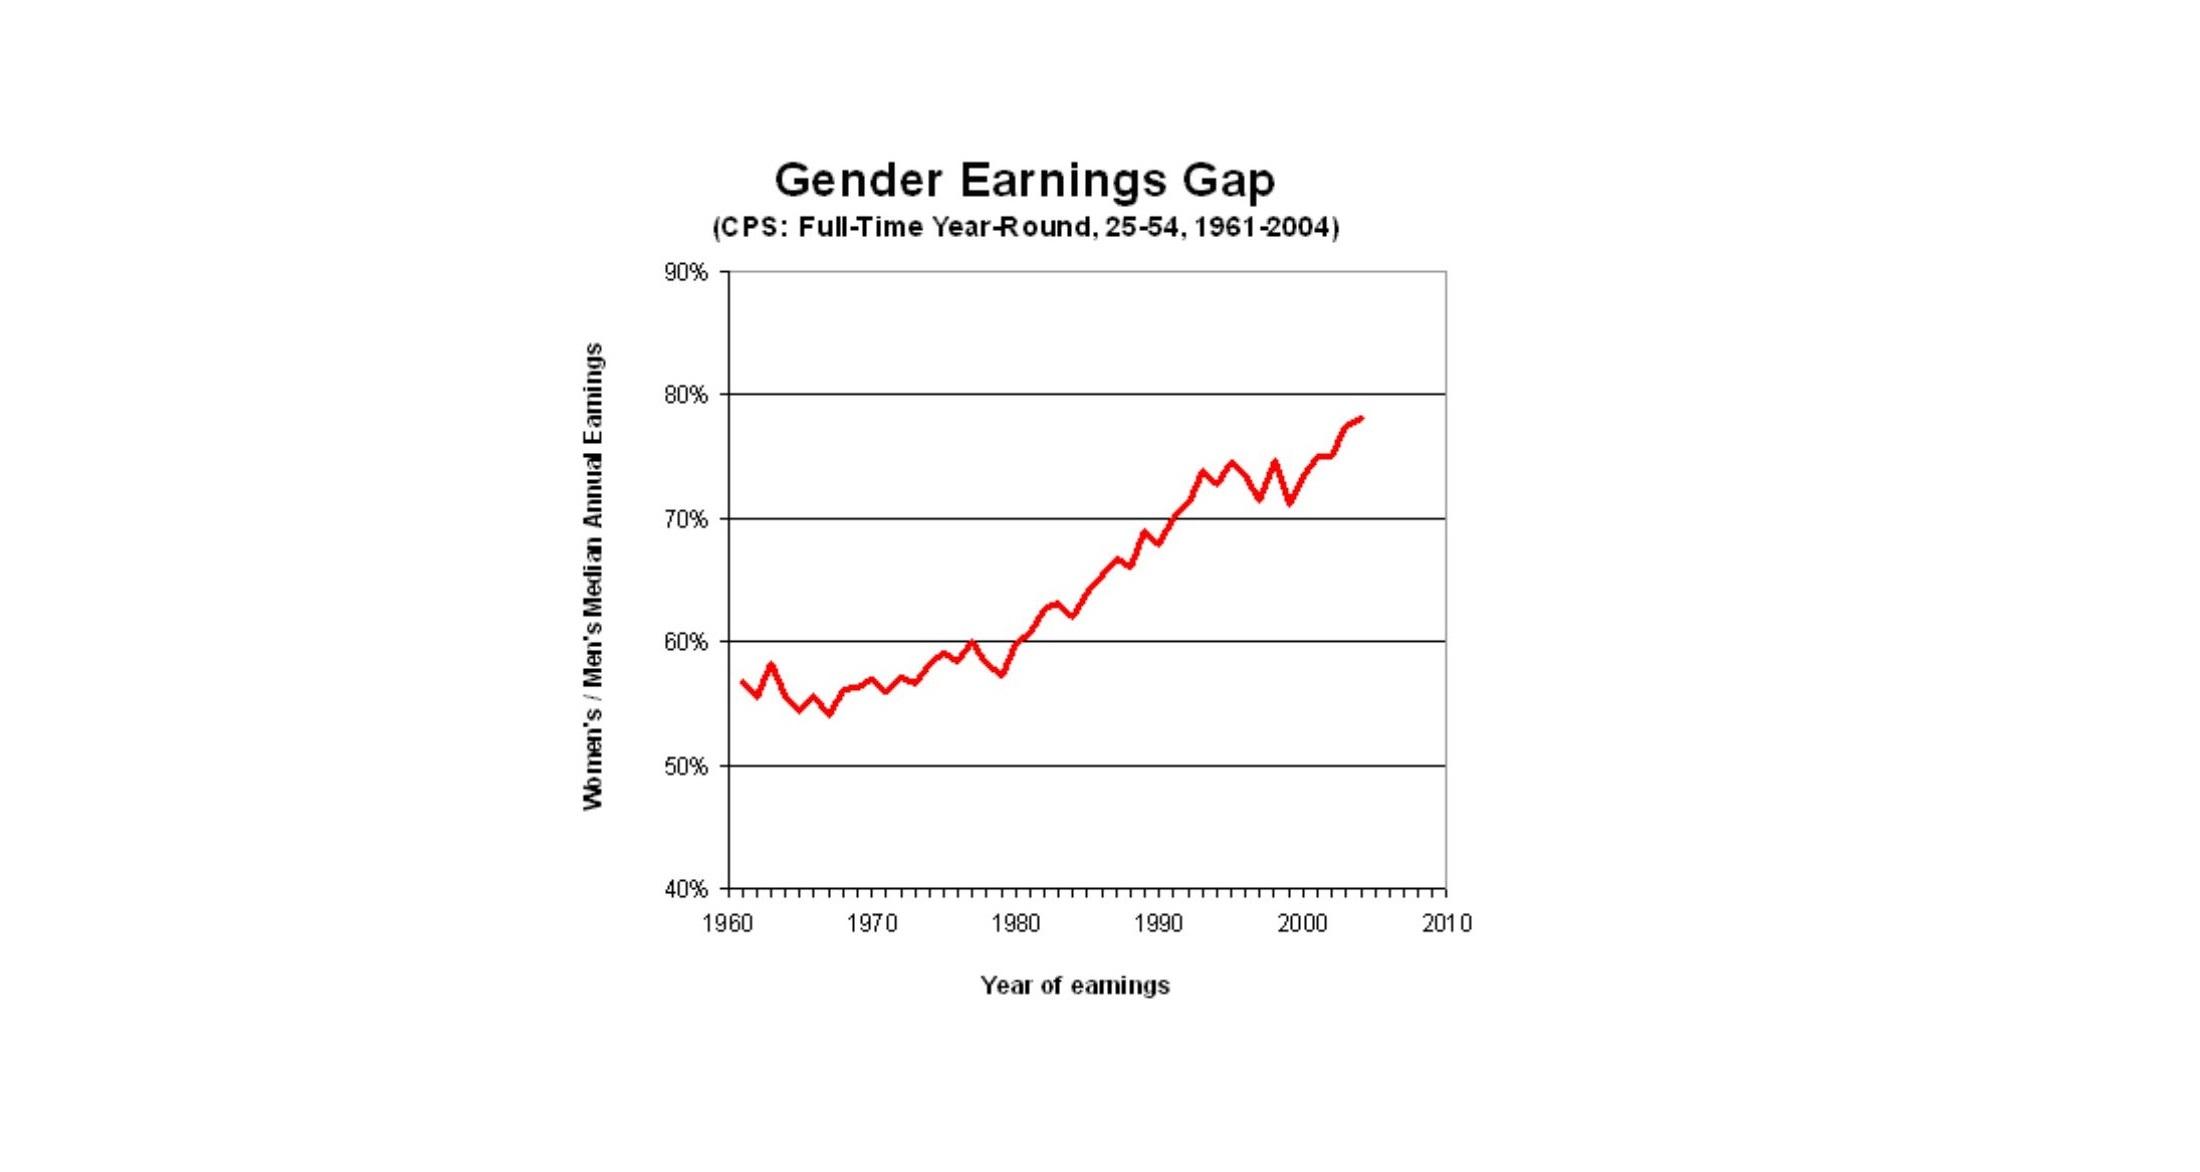
Although women have gradually reduced gender inequalities in various aspects of social and work life, such changes have been slowed down and stalled in recent years1, 2, 3. What is worse, researchers from the University of Maryland found with a set of longitudinal data that the gender earnings gap has been increasing and reaching the highest it has ever been (Figure 1).
Other than the increasing wage gap, the number of female leaders in organizations hasn’t improved much in the past 20 years. According to data collected by U.S. Equal Employment Opportunity Commission (EEOC)4 between 1996 and 2015, although there is a slight increase in the percentage of female mid-level managers in private industries, the percentage of executive-level officials barely increased over the 20-year period of time (Figure 2).

In fact, there are only 27 female CEOs—roughly 1 in 20—in the Fortune 500 list as of January 20185. In S&P 500 companies, the higher the position, the fewer the women in those roles5,6. The situation for female leaders is not better in the political world. According to a statistical archive of women in national parliaments, as of December 1, 2017, only 23.5 percent of parliament leaders across the world are females, a slow increase compared to 23 percent in 2016 and 22.7 percent in 20157.

Therefore, the challenges for females in the workplace still widely exist.
The current study will adopt a comprehensive approach to better understand the factors that interfered with women’s career success in their different life stages. We used two large U.S. national longitudinal datasets that provide great insight into factors that have impacted females’ career success.
The Past
The Wisconsin longitudinal data was collected by the Wisconsin Longitudinal Study (WLS, 1957 - 2011) team. This data dates back to 1957. WLS is a longitudinal study of more than 10,000 men and women who graduated from Wisconsin high schools in 19578,9. During the study, interviews and surveys were conducted every few years on various aspects of the participants’ work, life and health. The last round of the data collection occurred in 2011. We used the information to explore some factors that affected females’ career development in mid to late 1990s.

As was presented in Figure 4, in 1964 (seven years after most of the participants graduated from high school) male participants reported to have higher education levels than female participants, even though females performed better in high school and more female students planned to continue education during the first round of data collection (1957). By 1964, one’s marital status was found to affect the gender difference in relationship between the 1957 education plan and 1964 education attainment, such that the relationship between the education plan and education attainment is strongest for married (or formerly married) males, but the weakest for married (or formerly married) females. Therefore, it is possible that during 1960s, some females’ education plans were affected by their marital status.

Marital status also affected one’s income change. An analysis of occupational income score change between one’s first job and his/her job in 1970 revealed that married males tended to have higher income increases than single males, while married females showed to have less income increase than single females – even after participants’ education and occupation prestige were controlled (Figure 5). Meanwhile, a growing gender income gap was also found in both 1974 ($12,697; early career) and 1992 ($33,660; later career), such that males tended to have higher income than females on average.
The number of children one has was also found to have different effects on income between the genders, such that number of children didn’t affect the male participants’ income, but had a negative effect on the females’ income in their early careers – after we controlled for the income of the spouse, participant’s occupation and education (Figure 6).

Today
Although the WLS data helped us identify a few factors that have affected women’s career development, one can argue that the data and results are relatively dated. To see if there are changes over time in the factors that interfere with a female’s career path, we turned to a more recent longitudinal data set to conduct further analyses.
The National Longitudinal Survey of Youth 1997 (NLSY97) data collects data from more than 8,000 U.S. youths between 13 to 17 years old, starting from 199710. This ongoing cohort has been surveyed 17 times ever since the initial interview in 1997, and data are available until 2015 or 2016. Using this dataset, we were able to have a deeper look into the educational achievement and earlier
career achievement of today’s young workforce.
We selected data from the years of 2006, 2010, and 2015 for the current study because most participants have already graduated from college and started their early career development during this time period. The relationships of annual income, hours worked per week, marital status, and number of children were investigated.

Different from the WLS 1957 cohort, today’s women are more educated. More females have graduated from high school, enrolled in college, and received both bachelor’s and higher degrees than males (Figure 7). Females also reported to have occupations that have slightly higher occupational prestige scores11 than male participants from 2006 to 2015.

However, the growing gender income gap did not slow down due to the increase in more educated females, especially for married females. As was shown in Figure 8, a significant income gap between the genders has been consistently increasing between 2006 and 2015, consistent with findings from the Wisconsin Longitudinal Study (WLS). Such a gap, however, is even wider for married participants than those who are single. Meanwhile, a gender gap between hours worked per week was also found through the investigated years, such that males tend to work significantly more hours per week than females. Such a gap became increasingly wider for married participants, but it remained relatively consistent for participants who are single.

We then examined the relationship between one’s number of children and income change. Similar to the findings from the WLS data analyses, the number of children in the household in 2015 had a significantly different relationship with income change between 2006 and 2015 for male and female participants (Figure 9), even after participants’ education level, occupational prestige and marital status at 2006 were controlled in the analyses. Male participants with more children (1 standard deviation above average) had more income increase than male participants with less children (1 standard deviation below average), while females with more children showed significantly less income increase than those without children. However, the results can only lead us to infer the effects of children on career success. We cannot conclude causality between number of children and income change due to the data points selected.
For example, male participants with larger income increases may want to have more children than those with smaller income increases. While female participants who have more children may tend to stay home or work less hours, thus they have smaller income increases than those with no children.
Further relative weight analyses examined how gender, marital status, number of children, occupation, hours worked per week, and education collectively affected participants’ income in 2015 (Figure 10). When combining data from both female and male participants, gender, marital status, occupation, hours worked per week, and education counted for 15 percent, 7 percent, 11 percent, 29 percent, and 37 percent of explained variance in annual income in 2015 respectively. It showed gender alone explained more known variance in income than occupation.
Number of children showed no effect on the annual income. However, when analyzing the data by gender, we found some interesting results.
Analyses showed that the number of children one has resulted in a negative effect on females’ income (4 percent), but a positive effect on males’ income (8 percent). While marital status was the reason for only 1 percent of variance in income for females, it accounted for 16 percent of income variance for male participants, such that married participants tend to have higher levels of annual income. Occupation and hours worked per week were reasons for similar variance for income of both genders, however, education led to more income variance for females (57 percent) than males (36 percent).

Figure 10. Comparing the percent of explained variance in income
Discussion
The current study confirmed past findings on increase in between gender income gaps over the past few decades. We were also able to find factors that may have contributed to such differences. Marital status and number of children were found in both data sets to have relatively positive effects on males’ income and negative effects on females’ income. Gender alone accounted for more variance in income than occupation prestige scores, which showed great disadvantages for females at work in general. With education being the reason behind more income variance for females than for males, it seems that to catch up with men in income, females have to invest more in education.
We understand that income is decided by many complicated factors, and female career success is affected by factors beyond what we have examined in this white paper. In the current study, we mainly focused on the impacts of family, work and education on income. There might be fundamental gender differences in career pursuits. In the Wisconsin Longitudinal Study, when students were surveyed in high school, there were significant gender differences in future career aspirations. Male students aspire to take up occupations that have higher income scores in the future than the females selected. Consequent analysis showed a positive relationship between career aspirations and future career choices and income, but we need more data for further examination.
To close the increasing income gaps and to move forward with gender equality, it is important to acknowledge the factors that have contributed to such female disadvantage. Society, organizations, and families need to work together to slow down and eliminate such trend.
References
1Cotter, D.A., Hermsen, J.M., & Vanneman, R. (2007). The stalled gender revolution. [Data files and figures]. Retrieved from University of Maryland website: http://www.vanneman.umd.edu/endofgr/matrix.html
2England, P. (2010). The gender revolution: Uneven and Stalled. Gender and Society, 24, 149-166.
3Scarborough, W. (2018). What the data says about women in management between 1980 and 2010. Harvard Business Review. Retrieved from: https://hbr.org/2018/02/what-the-data-says-about-women-in-management-between-1980-and-2010?utm_source=twitter&utm_medium=social&utm_campaign=hbr
4U.S. Equal Employment Opportunity Commission (2015). 1996 to 2015 Employment Statistics: Job Patterns for Minorities and Women in Private Industry [Data files]. Retrieved from: https://www1.eeoc.gov/eeoc/statistics/employment/jobpat-eeo1/
5Catalyst. (February, 2018). Women CEOs of the S&P 500. New York: Catalyst.
6Statistical Overview of Women in the Workforce (2017). Catalyst Knowledge Center. Retrieved from: https://edubirdie.com/blog/women-in-the-workforce-global
7Women in National Parliaments: Situation as of 1st December 2017. (2017). Statistical Archive of Women in National Parliaments [Data Archive]. Retrieved from: http://archive.ipu.org/wmn-e/world.htm
8University of Wisconsin, Madison (1957 to 2011). Wisconsin longitudinal study [Data file and code book]. Retrieved from: https://www.ssc.wisc.edu/wlsresearch/
9Herd, P., Carr, D., & Roan, C. (2014). Cohort profile: Wisconsin longitudinal study (WLS). International Journal of Epidemiology, 43, 34-41.
10Moore, W., Pedlow, S., Krishnamurty, P., & Wolter, K. (November, 2000). National longitudinal survey of youth 1997 (NLSY97): Technical sampling report. National Opinion Research Center, IL: Chicago. Retrieved from: https://www.nlsinfo.org/content/cohorts/nlsy97/other-documentation/technical-sampling-report
11National Opinion Research Center. (1989). Occupational Prestige Scores. [Data file]. Retrieved from: http://ibgwww.colorado.edu/~agross/NNSD/prestige%20scores.html